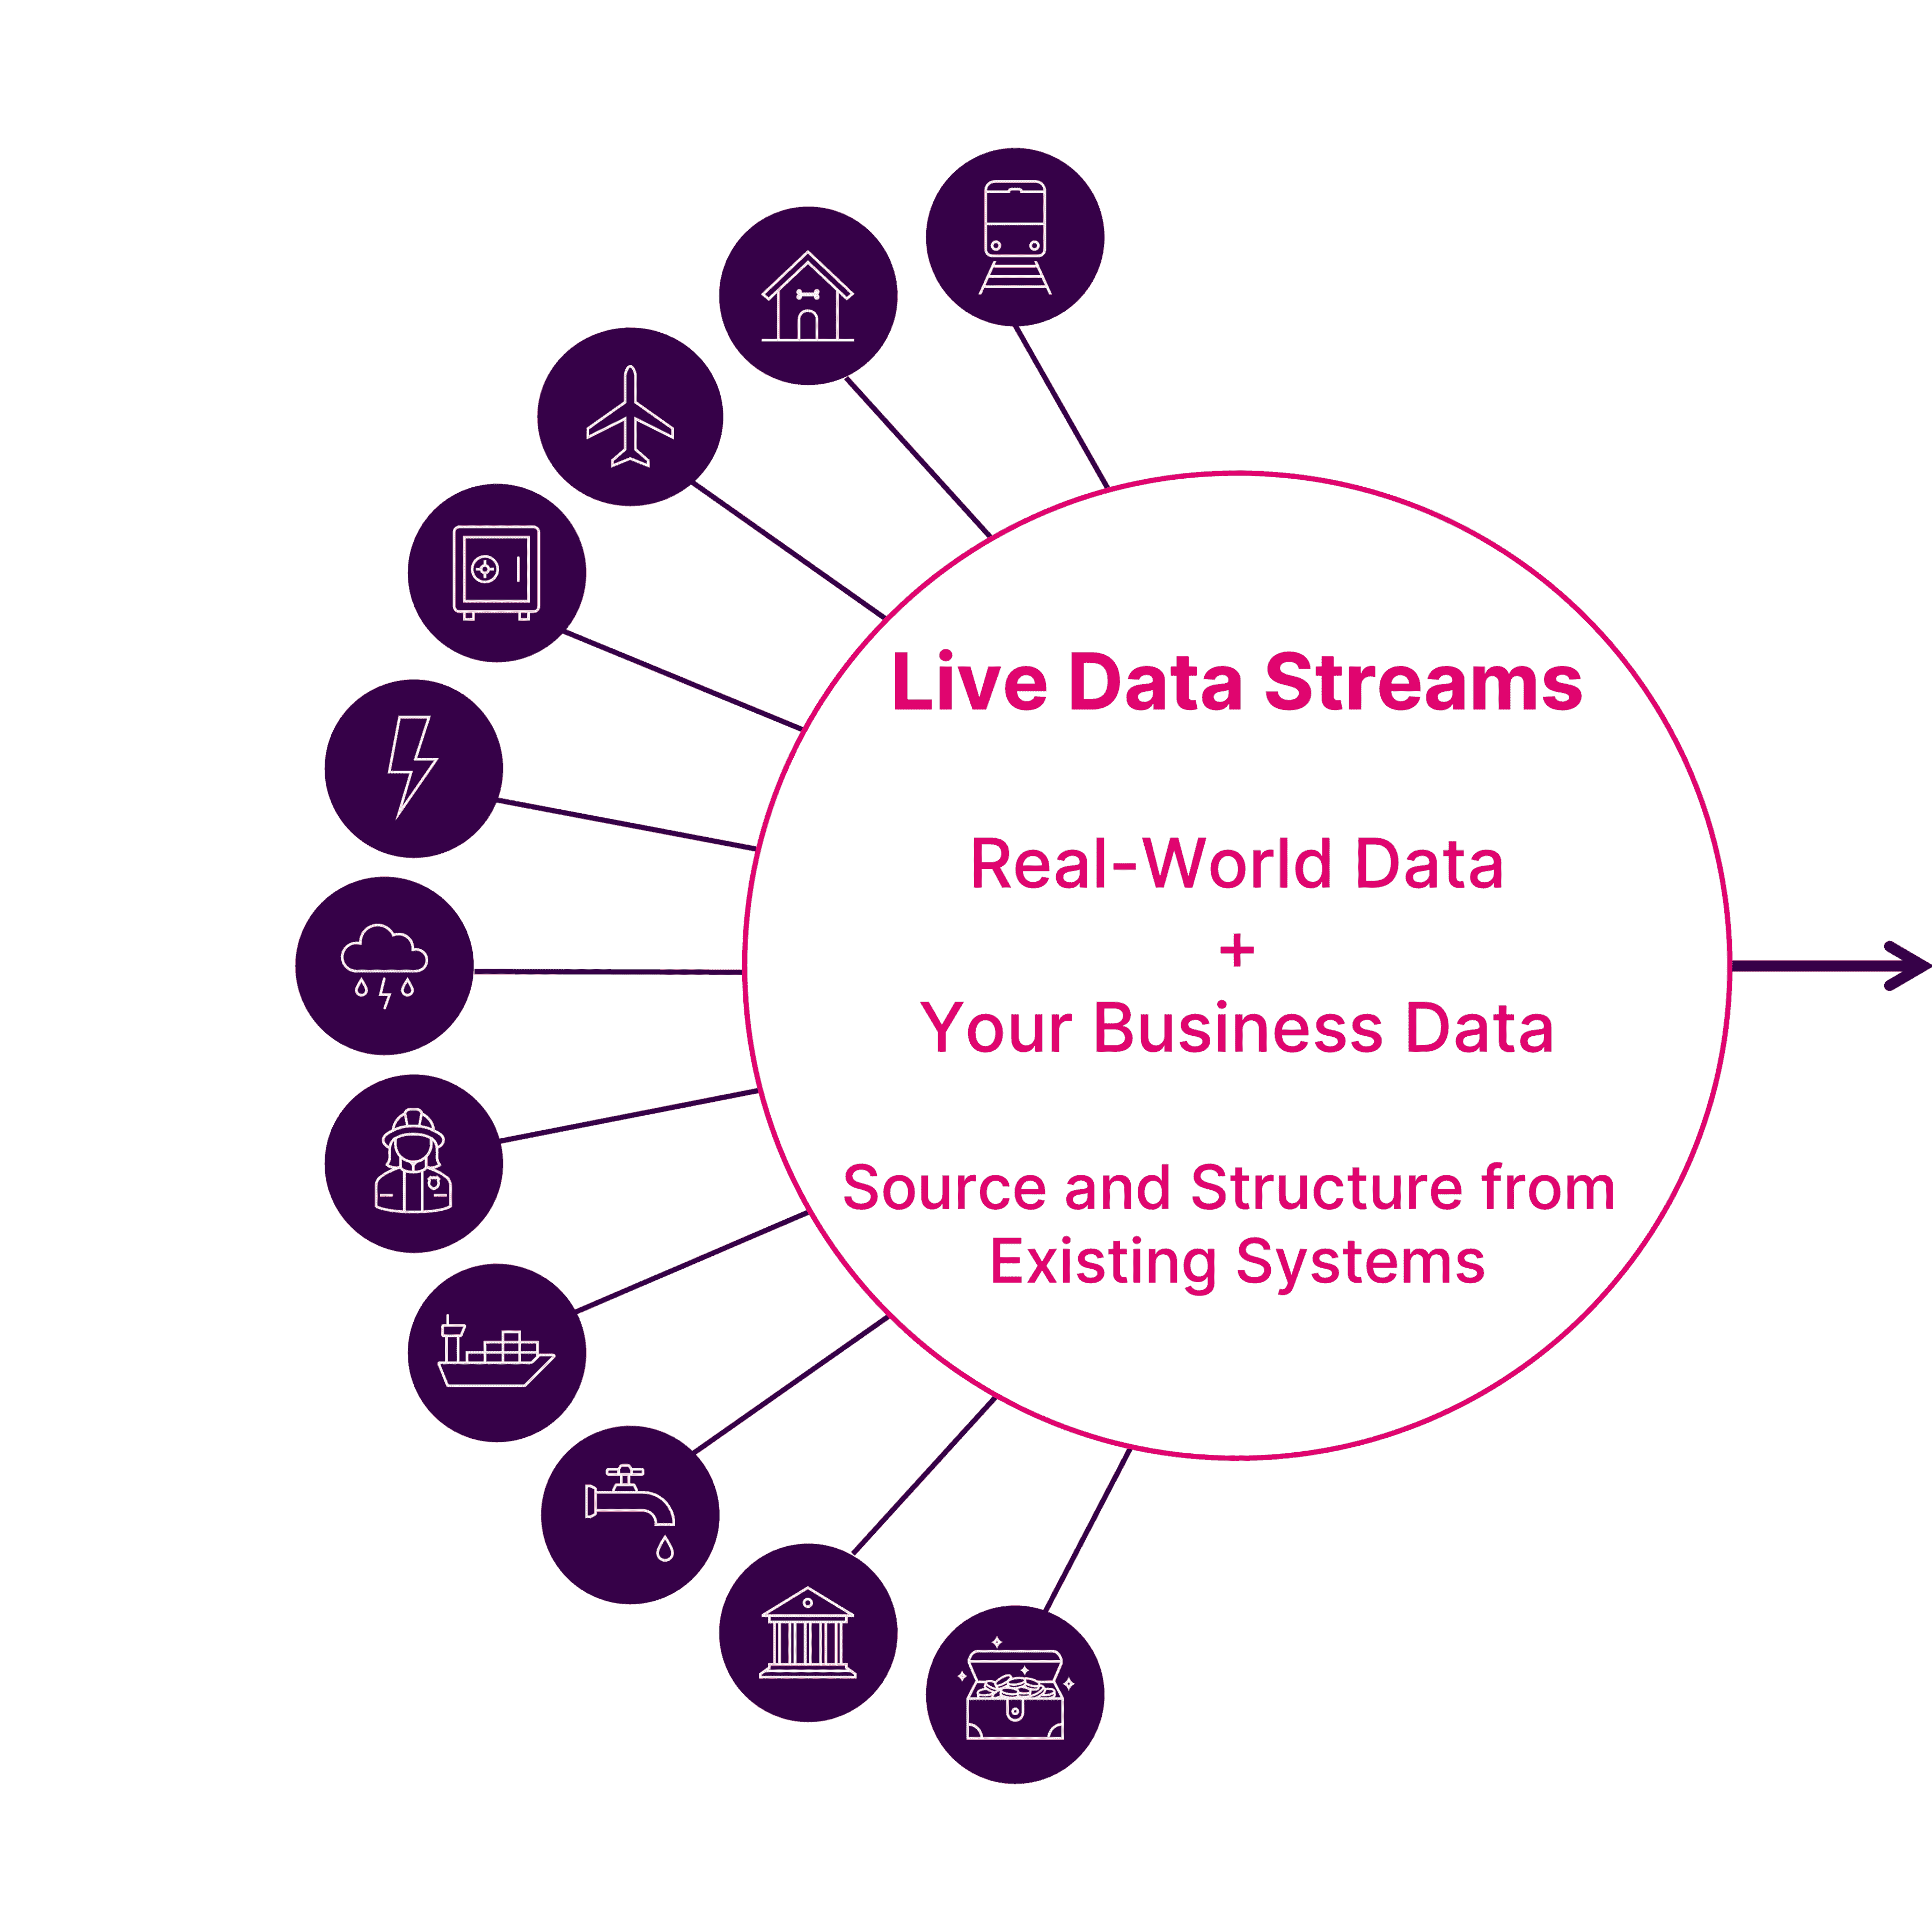
Live Earth Logo

888.813.4551

The Live Earth Platform

To Unearth the Value You Need at Speed
You Need the Right Data at the Right Time

With the ability to ingest over 250 million events hourly from thousands of sources, Live Earth’s operational analytics platform helps eliminate data silos, remove data latency, and avoid data fatigue.

live data streams graphic
Live Data Streams
data inside cloud
Live Earth Cloud
Operational Analytics on laptop
Live Earth Data Visualization Platform

Make Informed Decisions When It Matters Most

Live Data Streams

Live Earth allows you to integrate your data analytics with the most robust and diversified selection of third-party data streams. It’s this contextualized data that yields the intelligence to help you achieve deeper insights and identify hidden opportunities with live data streamed from many different sources.
Icon with red base

Third Party Data

  • Weather
  • Transportation
  • Traffic
  • Social Media
  • Demographics
  • EMS
  • GPS
  • Retail Data
Icon with red base

Your Business Data

  • Business
  • Analytics
  • Financial
  • Fraud Detection
  • Supply Chain
  • Security Operations
  • CRM
  • IoT Data

 Uncover hidden opportunities with live data streaming

Live Earth Cloud

Live Earth is a next-generation SaaS business intelligence solution built for the modern enterprise.
disk storage icon

Aggregate All Data

Aggregate vast amounts of time- and geo-location-based data to break down internal silos, increase collaboration, and more quickly spot and leverage trends, risks, and opportunities in real-time.
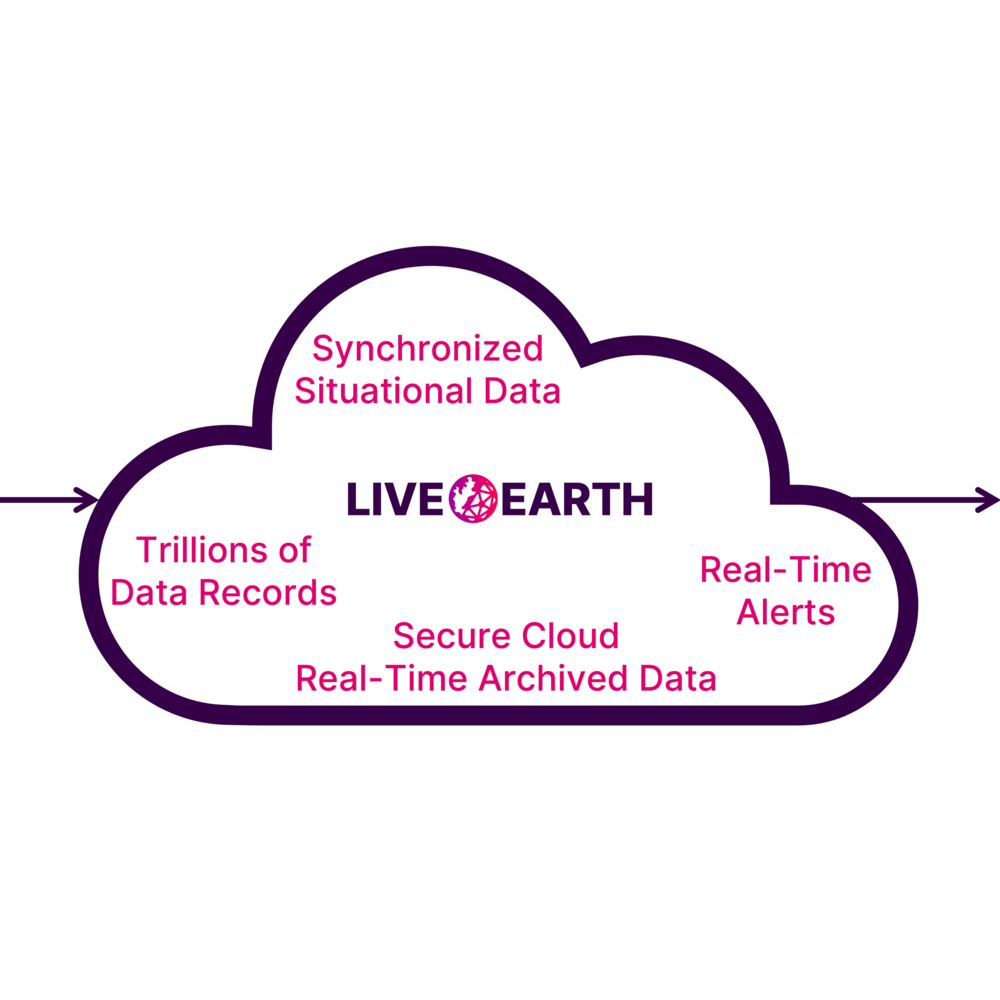
brain icon

Unmatched Speed

The Live Earth operational analytics platform ingests 250+ million events per hour from multiple sources with a variety of data update rates and different data stream latencies.

cloud icon

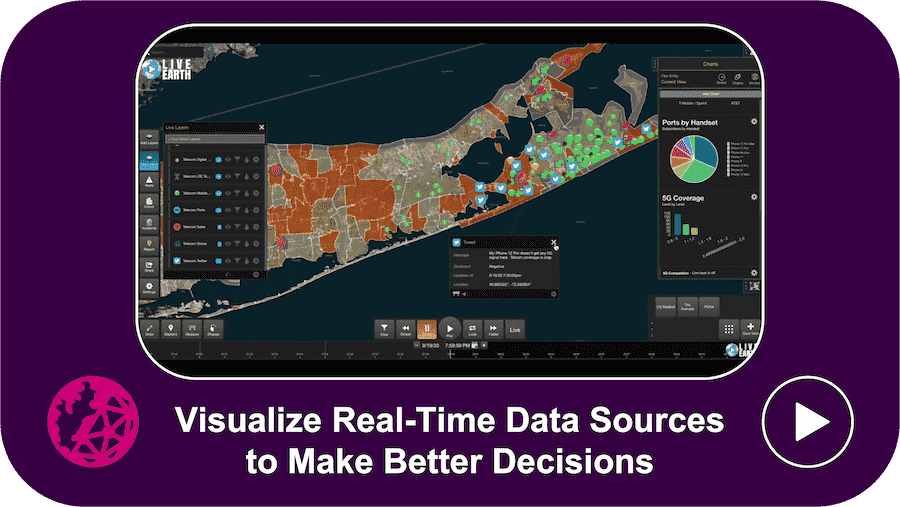
Rules-Based, Real-Time Alerts

Whether you’re monitoring IoT sensors, social media, traffic or financial transactions, Live Earth Alerts Engine gives you an unprecedented ability to detect and react to aberrant or anomalous activity to minimize risk and optimize business efficiency with our real-time actionable insights.

stopwatch icon

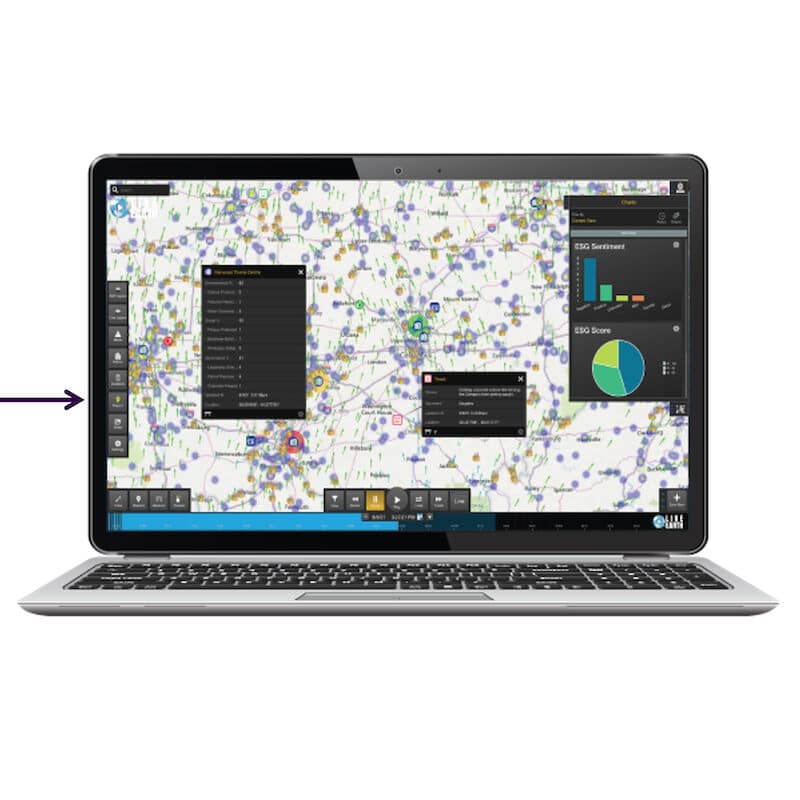
Better Business Intelligence

Live Earth’s Intelligent Insights make data visible and usable by aggregating and visualizing metadata of one or multiple data sources (or layers) in an intuitive display format. The addition of a proprietary data sequencing and storage system provides real-time business intelligence for better business outcomes.

Live Earth Visualization Platform

Live Earth’s real-time data visualization technology leads the data streaming analytics industry when it comes to deployment speed, ease of use, and extensibility. For operational analytics in real-time from real world data synchronized with your internal data, Live Earth’s data visualization platform is world class.

An Open Platform Design that Requires Little to No Training

Real-Time Alerts Engine

Real-time alerts can be created to generate notifications in multiple ways. These notifications allow users to focus on relevant situations as soon as they happen.

Machine Learning

Apply advanced computational algorithms to spot patterns and make decisions faster with machine learning.

Interactive Timeline Looping

Choose the moment in time you want data to appear on the map – live view or a historical analysis. Use play, pause, and rewind DVR controls, select date and time, or drag the timeline.

Share Content

Publish content out of Live Earth through screenshots, shareable links, and saved views and share with internal resources (who may not have a Live Earth account) or with external resources.

Video Wall

Drag and drop live feeds into the video wall and combine multiple video feeds into one view, allowing all feeds to be reviewed in context with each other. Name and save your customized walls for organization and quick access.

Geofencing

Draw geometric shapes anywhere on the map, which can be used to set up geofences that define boundaries and generate configurable alerts in the Live Earth data visualization platform.

Live Charts

Create real-time data visualization charts with live insights of dynamic data represented on the screen. Zoom in or out, and the data represented on the chart changes with the user’s view.

Live Earth Application Form