Improving Business Performance
In today’s data-driven world, businesses rely on data to make informed decisions. Furthermore, the sheer volume of data generated by modern companies can be overwhelming, making it difficult to draw meaningful insights from the data. This is where data analysis and visualization software can help an organization. Data analysis and visualization software provides businesses with the tools they need to collect, process, analyze, and visualize data in a way that makes it easy to understand and draw meaningful insights from it.
What is Data Analysis and Visualization Software?
Data analysis and visualization software is a type of software that helps businesses collect, process, analyze, and visualize data. Additionally, it provides a user-friendly interface that allows users to explore and analyze data, and create visualizations that help communicate the insights they have drawn from the data.
How Data Analysis and Visualization Software Helps Improve Business Performance
1. Better Data Management
Data analysis and visualization software makes it easier for businesses to manage large amounts of data. The software can automate the process of collecting data from various sources, and store it in a centralized location. This ensures that businesses have access to any data they’ll ever need at any given time. In addition, the software can also be used to clean and transform the data, making it easier to analyze and draw meaningful insights from it.
2. Improved Data Insights
Data analysis and visualization software provides businesses with powerful tools for exploring and analyzing data. The software makes it possible to discover hidden patterns, relationships, and trends in the data that might not have been obvious otherwise. With these insights, businesses can make informed decisions about how to improve their performance.
3. Better Communication of Data Insights
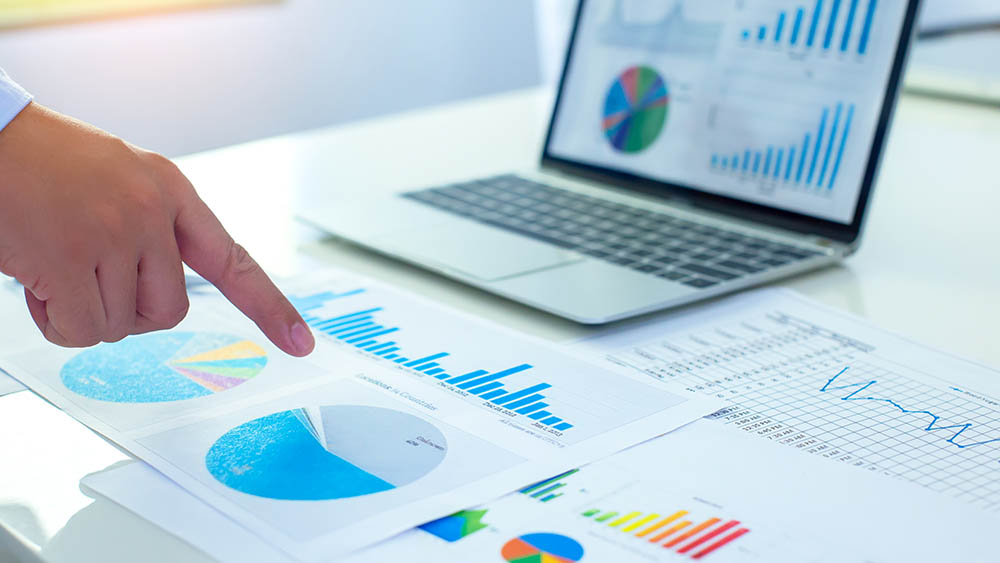
Data analysis and visualization software makes it easy to communicate the insights that have been drawn from the data. The software provides a variety of visualization tools, such as charts, graphs, and dashboards, that make it easy to communicate complex data insights in a way that is easy to understand. This helps businesses share their findings with stakeholders for their approval of new initiatives or projects.
4. Increased Collaboration
Business use data analysis and visualization software to encourage collaboration between different departments within a business. The software makes it easy for different departments to share data and insights, which helps improve communication and collaboration. In addition, the software can also be used to track the progress of projects, making it easier to monitor and measure the impact of new initiatives.
5. Improved Decision-Making
Data analysis and visualization software can help businesses make better decisions. The software provides a wealth of information vital for informed decision-making. For example, businesses can use the software to analyze sales data to identify which products are selling well, and which are not. With this information, businesses can therefore make informed decisions about which products to stock, and which to discontinue.
6. Increased Efficiency
Data analysis and visualization software can also help businesses to become more efficient. The software can automate many manual tasks, such as data collection and analysis, freeing up employees to focus on other tasks. In addition, the software can also be used to streamline processes, such as budgeting, forecasting, and reporting, making it easier for businesses to complete these tasks in a timely and accurate manner.
7. Better Budgeting and Forecasting
Data analysis and visualization software can help businesses to improve their budgeting and forecasting processes. The software provides the tools necessary to analyze past performance and make informed predictions about future performance. Finally, this helps businesses to identify areas where they can mitigate risks and improve financially.
While these 7 ways are very common, many organizations use data analysis and visualization software in many other ways as well. For help with your needs in any of these areas, contact us today.

