Data is at the core of most businesses today. Business leaders use data to understand their internal and external environments better, predict trends, and improve decision-making.
It’s not enough to collect vast amounts of high-quality data, though. Businesses also need ways to dig deeper into the data and turn it into something they can use. Data visualization is one of the tools designed to do exactly that.
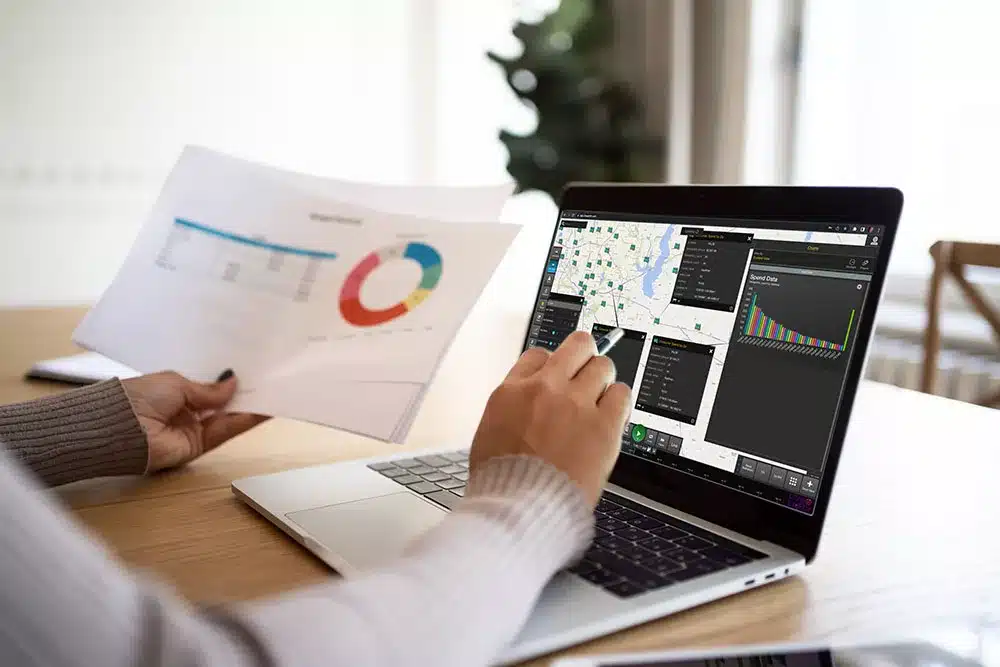
Visualizations are data representations in visual displays such as charts, maps, infographics, and graphs. They range from elementary forms like a basic line or bar chart to complex, interactive dashboards. All of these visualizations, from the most simple to the most complicated, serve the same purpose: communicating information from data in a way that’s easy to understand.
So How Does Visualizing Data Help Businesses?
Visualizing data simplifies the complex information hidden in the large data sets that many companies collect. Consider which is easier: finding insights by looking at a large spreadsheet full of data or by looking over graphs and charts representing that data set.
Visualizations don’t replace other methods of data analysis, however. Using this strategy to extract insights from your data should complement your company’s other forms of data analysis.
Anything that can help businesses do more with their data is incredibly valuable. Visualizing this data is one way to make your data more usable within your organization. Without practices like visualizing data, you risk missing out on valuable insights and trends hidden in your large data sets.
Data Visualization Use Cases In Retail
Visualizing data has applications across industries, but it’s instrumental in retail. Visualizations help retail companies dig deeper into each area of their businesses, from marketing and sales to inventory and logistics.
Every one of these business areas likely collects massive amounts of data about their operations and results. From there, the trick is finding ways to use that data effectively, and that’s what visualizations are for.
Let’s look at some specific use cases for visualizations in the retail industry:
Supply Chain Management
Managing your supply chain well is key to the success of any retail business. A single problem somewhere in your supply chain can throw your entire business off course and be incredibly costly. Using data visualizations help you prevent these issues while optimizing your supply chain.
For example, you can create visualizations of your customer demand data. These visualizations will help you discovers patterns in customer demand and better predict future demand, allowing you to optimize your inventory accordingly. You can also use visualizations to track the performance of your suppliers over time. Looking at these charts makes it easier to determine whether suppliers are underperforming and you need to look for alternatives.
With visualizations of your supply chain flow data, you’ll be able to find points where your supply chain isn’t moving as efficiently as possible. Depending on the data you have available, you may even be able to discover insights that tell you how to address this congestion point.
E-commerce Management
The e-commerce sector is a huge component of retail sales, especially post-pandemic. E-commerce sales are growing and are expected to total over $1.1 trillion in 2023, which will continue to rise in the coming years. Currently, e-commerce accounts for 23% of retail sales, but experts expect that percentage to increase over the next decade.
In other words, retail businesses have to effectively manage their e-commerce efforts to keep up with this shift. Visualizing data related to e-commerce sales can help.
Take customer acquisition data, for example. With e-commerce customers, businesses typically have access to lots of data about where their customers come from and how they arrived at the website to make a purchase. You could analyze this data in its raw form, digging through the information to try and determine which acquisition channels are working effectively and which aren’t. That process would be tedious and time-consuming, though. Instead, by converting the data into a visual form like a bar chart, your whole team can immediately see which channels are successfully bringing in e-commerce customers.
By visualizing your e-commerce data, you’ll be able to answer questions like the following quickly:
- How many visitors to your site do your email campaigns bring?
- How often do your customers abandon their carts online, and what percentage eventually returns to complete the purchase?
- How long do visitors stay on your website on average?
- What is the conversion rate of various pages on your site?
Marketing
Most companies today use a variety of marketing channels to promote their products and services. Managing these multichannel campaigns can be complicated, especially when monitoring each channel’s success. Even when you have all that data available, you still need to find a way to make sense of it and apply the data to improve your campaigns.
That’s where visualizing data comes into play. Create charts, graphs, and other visualizations to see exactly how your campaigns perform. You’ll find areas of your multichannel campaign that aren’t performing as well as the others and could use improvement. You’ll also be able to see which campaign elements are particularly successful.
For example, you may see that your paid media channel is underperforming compared to your social media channel. With this information, you can adjust your campaign and get more value for your marketing spend.
Boost Your Retail Enterprise with Data Visualizations
Data visualizations help you get more out of your data by making it accessible, understandable, and engaging. Anyone—with or without data training—can look at data visualizations and discover insights hidden in the data. This accessibility means more team members can interact with your data and extract value from it.
In the retail industry, businesses are working with incredible amounts of data. Even with so much data, though, many companies aren’t able to make effective, data-backed decisions. Creating data visualizations with software like Live Earth is the way to become a data-driven enterprise. Contact Live Earth today to learn how visualizations can boost your retail business.

