Every business leader wants to grow their business — the big question is, how do you approach that goal? It all starts with an in-depth analysis using data visualization analytics. By analyzing your enterprise, its business environment, and the competitive landscape, you’ll have the information you need to adapt and propel your business to greater heights.
While it’s possible to conduct manual analysis, the right data visualization analytics tools are much more effective. In particular, data visualization tools help you analyze relevant data by presenting it in easy-to-understand graphics like charts and graphs. Visualizing your data is the ideal way to gain actionable intelligence and make unexpected discoveries that aid in your business growth.
Here are some of the applications of data visualization tools for you to consider:
Research Your Competitors
It’s one thing to have an idea of how your company is performing compared to your competitors, but seeing it in clear, engaging visuals is much more impactful. You can use data visualizations to conduct research into your competitors and present the information in a way that makes it understandable even to team members who don’t have a data background.
Data visualizations of competitor data will help you discover what your competitors are doing well and potentially what mistakes they’re making that you should avoid. You’ll get a bird’s eye view of your competitors so you can adjust your business strategies to outperform them. Traditional visual competitor research involves completing diagrams like a SWOT analysis or a PEST analysis. While there’s nothing wrong with either of these analyses, data visualization tools can allow you to dig deeper.
The top data visualization tools include features like interactive timelines that allow you to easily track data related to your competitors over time. Take pricing, for example. Looking at your competitors’ pricing can help inform your own prices. You can use data visualization analytics to better understand how your competitors have historically priced their products or services.
Another part of competitor research is looking into your competitor’s marketing efforts. Use data visualization tools to gain insights into activity on your competitors’ social media activity or search engine optimization (SEO) efforts, among other marketing data.
Segment Your Audience into Groups
Your customer base is made up of many different types of customers and you can segment them into groups — known as audience segments — according to their shared characteristics. Segmenting your audience makes it possible to market your products or service in a more personalized way, leading to stronger marketing efforts.
Marketing material that’s written for a general audience can feel generic and stale. Rather than addressing your whole audience at once, use data visualizations to segment your audience into groups and develop more targeted messaging. Data visualization will help you see how your consumers fit into different groups according to their demographics, behavior, engagement levels, and other factors. From there, you can develop strategies for reaching each of these specific groups in a way that resonates with them.
Consider simple segmenting by age, for example. Data visualization would allow you to see how many customers you have in each age range (e.g. 18-24, 25-34, 65 and older, etc.) and then you could add in other information like gender or income to create more specific segments. Once you know what segments you want to target, you can brainstorm unique messaging that would catch the attention of people in each group. The result of audience segmenting done right is stronger relationships with your customers and a higher return on your marketing efforts.
Map Out Buyer’s Journeys
Understanding and mapping out the buyer’s journey — the steps consumers take on their way to completing a purchase with your business — is essential for your marketing team. Research from the Aberdeen Group even found that companies that use buyer journey maps see a 79% higher annual increase in cross-selling and upselling revenue over companies that don’t map out buyer journeys.
The buyer’s journey starts when consumers are first introduced to your product or service. This could be when they see an ad for your company, hear a recommendation from someone they know, or conduct an online search with keywords relevant to your business, to name a few possibilities. Then, some consumers may take an interest in your business and become prospects, looking into your products and potentially comparing you to your competitors. From there, some prospects become leads as they get more serious about buying your products. Finally, some leads turn into customers by completing a purchase.
These are just the broad steps in the buyer’s journey. As you’re mapping out buyer’s journeys for your company, you should use more specific steps that are tailored to your company and your customers.
Data visualization tools don’t just help you visualize the steps in the buyer’s journey — they help you dig deeper into details like how much time customers spend between stages in the journey or what percentage of prospects turn into customers. Looking at your buyer’s journey will help you identify weaknesses in your marketing efforts and opportunities to maximize conversions. Once you streamline your buyer’s journey maps, you’ll be able to shorten the sales process and generate more sales.
Define Your KPIs and Convert Them into Data Visualizations
Key performance indicators (KPIs) are metrics that allow you to measure the performance of your business and compare that performance against concrete goals. Unfortunately, looking at the raw data related to your KPIs isn’t especially useful. A visual representation of that data, however, can help your entire team quickly grasp trends in the KPIs and draw insights from them.
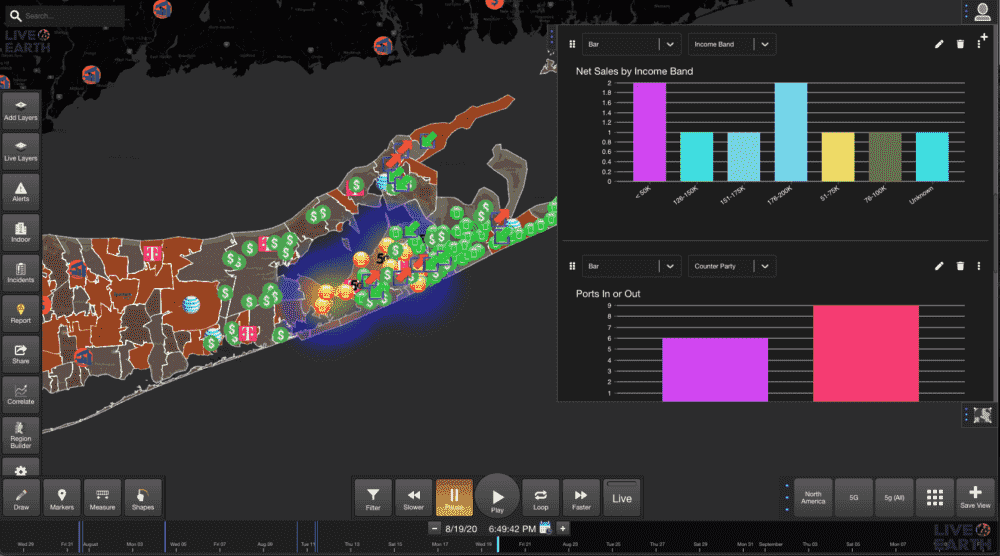
All you have to do is define your KPIs and use a data visualization tool to convert them into the most applicable visual representations. Geographic maps, for example, might be the best choice for displaying KPIs related to locations. Data visualizations empower teams within your enterprise to track their own performance, even without any data training. At a glance, everyone will have a better idea of what the company is doing well and what could use improvements.
Unlock Business Growth
Data visualization analytics is a secret weapon for unlocking business growth in the modern age. And to do it right, you need a strong data visualization platform like Live Earth. To learn more about the ways visualizing your data can transform your data, schedule a demo to see Live Earth in action.