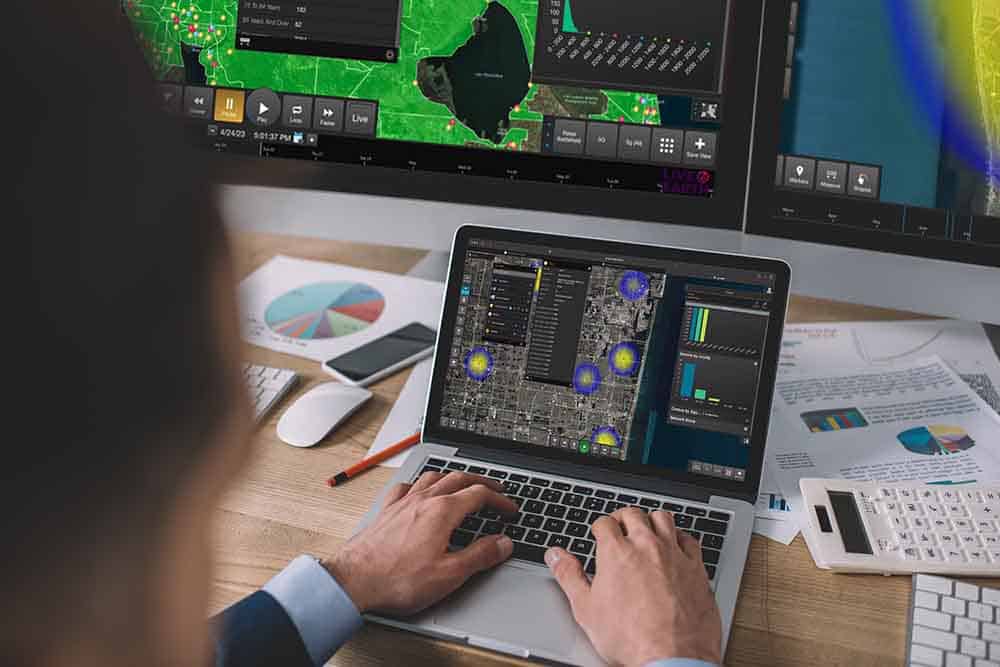
Businesses today rely on data to inform their decision-making and stay ahead of the competition. Among the many tools available for analyzing their information, big data visualization tools are the most impactful.
Data visualization converts data into visual representations like maps, charts, and infographics. The visual context helps bring your data to life, making it easier for viewers to understand the information and discover new insights. Creating and using data visualizations is increasingly popular among top enterprises, thanks to their many benefits.
In this article, we’ll focus on the power of big data visualization tools to enable team collaboration and communication.
How data visualization helps build collaborative cultures
Consider how many people within your enterprise can engage with highly complex raw data sets. Typically, even large organizations only have a dedicated data team and a few other professionals capable of technical data analysis. The rest of the organization outside those groups can’t meaningfully engage with the data.
Data visualizations change that. By transforming your data into more intuitive, accessible formats, data visualizations change how teams collaborate. Here are some ways data visualizations foster collaboration and communication in enterprises:
Removing barriers to understanding complex data
Data visualization software takes your complex data and represents it in a format anyone can understand. For example, spreadsheets full of data become recognizable visual formats like graphs and charts.
Now, anyone in your organization can look at the data and understand its information — regardless of their technical data expertise. Share these data visualizations during team meetings, emails, and company communications. Because these visualizations are accessible and understandable, your team can engage with them. You won’t have to worry about your data being isolated to only your data team and management.
Creating engaging materials
If you want to get people of your organization involved and working together, you must engage them. Compared to text or audio communication, visual forms of communication like data visualizations are simply more engaging for broad groups of people. These visualizations hook and engage audiences, laying the groundwork for productive team discussions.
The next time you want to engage your team members in discussions about data, consider using data visualizations. You may find that your teams are more enthusiastic and willing to participate in conversations about your data this way.
Beyond static data visualizations, you can also create interactive dashboards containing these visualizations. Dashboards incorporate several visualizations and allow users to explore the data themselves. Interactive components will only boost engagement further. When everyone’s engaged and interacting with the data, you never know what insights they’ll find together.
Meeting people where they are
A key idea in leadership is “meeting people where they are.” This means understanding where your team members are coming from and connecting with them in a way that works best for them.
There are numerous applications of the “meet people where they are” principle, but one of them is tailoring your communication style to your audience’s needs and preferences. Since 65% of people are visual learners, representing information visually is a good start. Most of your team members probably don’t want to sit through lengthy conference calls or read extensive text reports. They just don’t learn best through those methods. Creating data visualizations is the better alternative for connecting with most audiences.
Sharing insights between departments
Many data-driven modern enterprises encounter a significant problem — data silos. You have a data silo when only specific departments or groups in your company can access a given database. For example, your marketing and sales teams may be the only ones able to access your customer relationship management (CRM) data, even though other teams would benefit from access.
Using data visualizations makes it easier to share insights from your data between departments. It’s about breaking down the silo barriers, and including individual departments in the overall picture over a fragmented detail view.
For example, one group creates data visualizations that capture insights from their data and shares them with everyone. Other groups do the same with their data. Quickly, the whole organization can understand and engage with all the available data, regardless of what department they’re in.
Why data visualization is important for enterprises
If you want to foster a more collaborative work environment with open communication, don’t overlook data visualizations. Using visualizations engages audiences, breaks down barriers between departments, and makes your data more understandable. The benefits don’t end there, either.
Most enterprises today collect massive amounts of data. Sorting through all that data, analyzing it, and absorbing the key takeaways can be a time-consuming, costly process. In the time it takes your team to discover key insights, your competitors may have already pulled ahead.
Big data visualization tools change the way enterprises use their data. They allow business leaders (and their team members) to quickly uncover patterns and trends in data that they might have otherwise missed. As a result, business leaders can make data-driven, informed decisions faster than ever.
It’s not enough to simply collect the right data. You need your whole organization to be truly engaging with that data and uncovering the actionable insights within it. Data visualization tools help your team do exactly that.
Visualize and analyze your data with big data visualization tools
Getting more out of your data doesn’t need to be complicated. With data visualization tools, you can uncover new insights while fostering collaboration and communication in your enterprise. The key is choosing the right visualization tools for your organization.
Live Earth is a real-time data streaming and analytics platform designed to visualize geographical data. The Live Earth platform transforms your data and the industry’s most comprehensive dataset into interactive, engaging data visualizations.
Watch the data visualizations change in real-time to reflect changes in the datasets. From there, you can detect patterns faster, discover new insights, and make better-informed decisions for your enterprise. Schedule a demo of Live Earth today to see the data streaming platform in action.

