Strong business leaders are always looking for ways to arrive at better decisions. The standard approach to making business decisions involves identifying your goals and discussing the alternative methods of achieving those goals including the positives and negatives of each, before finally making and executing a decision. There’s nothing wrong with that process per se, but in the age of big data, leaders have more data they can — and should — use to inform their decisions.
Unfortunately, technical data analysis can be challenging to understand for those who aren’t well-versed in data science. Companies need an accessible and efficient way of presenting their analyses so that information can inform decision-making. That’s where data visualization comes into play.
What is Data Visualization?
Data visualization is a method of representing data sets through visual elements like graphs, charts, and infographics. When displayed visually, the data becomes much easier to understand and interpret, even for employees who don’t have deep knowledge of data science. Anyone in your organization can look at data visualizations and identify patterns in the data or draw conclusions from the information.
Using visualized data strategically is nothing new. In fact, as far back as the early 1800s, a civil engineer named Charles Minard used data visualization to represent data related to Napoleon’s Russian campaign on a map, including the number of troops, how far they traveled, and the temperature in each area. Just as military leaders could use visualizations like these to inform their military decisions, business leaders today can use data visualizations to make better decisions for their companies.
What is Data Visualization Used For?
So how exactly can you use data visualizations within your organization? Here are a few common use cases in business:
Healthcare Analysis
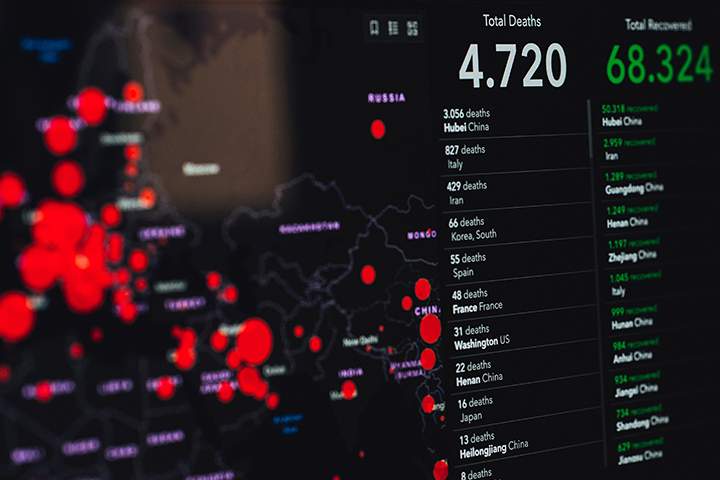
Data visualizations are incredibly valuable in the healthcare industry since they allow medical professionals to better understand what’s going on with their patients. During the COVID-19 pandemic, for instance, visualized data showed transmissions, cases, and other data organized by location helped healthcare providers stay prepared and informed.
On a more granular level, medical providers are able to gain insights into each patient’s health status in real-time. By recognizing trends and patterns, they may even catch possible risks before an issue occurs.
Detect Errors and Fraud
Fraud schemes can cost businesses millions and millions of dollars each year. With the help of machine learning, data visualizations can help business leaders detect and address fraud before it has disastrous consequences.
Detecting fraud requires companies to analyze vast amounts of data, potentially from many different internal systems. These visualizations take those large data sets and makes it possible for your security team to quickly notice potentially suspicious patterns. For example, they can help you find “fraud rings” — multiple people with specific characteristics who are involved in a connected series of events.
Track sales performance
Sales data is some of the most important data business leaders use when making decisions for their organizations. Visualizing data this way makes it easy to identify trends in sales performance, so executives can adjust their strategies as needed.
If, for example, a company had a goal of increasing sales by 5% this year, the leaders within the company could use visualized data to track the company’s sales performance each month and monitor their progress. They could even create more specific data visualizations that show sales performance for each product to better understand what’s selling well and what isn’t. From there, the leaders can adjust their promotions and marketing campaigns to stay on track.
Competitor Analysis
When you’re running a business, you don’t just need to understand what’s happening internally, you also need to understand what your competitors are doing. Using data visualizations, you can conduct more in-depth competitor analysis and get a better idea of your competitive landscape. This information can help inform your business strategies as you try to find a way to position yourself strongly against your competitors. Monitor your competitors’ product offerings, pricing strategies, sales tactics, and more at a glance with data visualizations.
Benefits of Using Data Visualizations
There are many benefits to using data visualization within your enterprise including:
Share information across your organization
Sometimes, you want to bring other team members into the decision-making process. Data visualizations make it easy to present data to wider audiences so more people can contribute to analysis and decision-making within your company.
Engage audiences
It’s fair to say that spreadsheets and pages of data analysis aren’t gripping to most people. By contrast visualized data engages audiences and keep their attention so they can meaningfully interact with the information on display.
Make faster decisions
In business, executives often need to make decisions quickly before circumstances change or they lose the opportunities at hand. Visualized data helps you absorb information quickly and arrive at your decisions faster than you would if dealing with text-based analysis.
Discover new insights
Though data visualizations generally present insights you have already found in your data sets through traditional analysis, they can also offer an opportunity for visual discovery. You may find new patterns or trends within a data set that you wouldn’t have noticed in a non-visual medium. Discover additional insights to better inform decision-making within your organization.
Find emerging trends
Data visualizations don’t just help you understand what happened in the past — they can also make it easier to identify emerging trends and predict what will happen in the future. By looking at patterns in your data, you’ll be better prepared for what’s likely to happen next.
Incorporate Data Visualization into Your Decision-Making Process
Data visualizations are designed to help business leaders make better, more informed decisions. If you’d like to get more out of your data analysis and improve decision-making within your organization, consider using a data visualization tool like Live Earth. Live Earth is a real-time data analytics and visualization platform that helps you make better-informed decisions in your enterprise. The rich, intuitive visualizations offer unprecedented insights into your data. Contact us today to visit with one of our consultants and see the platform in action.