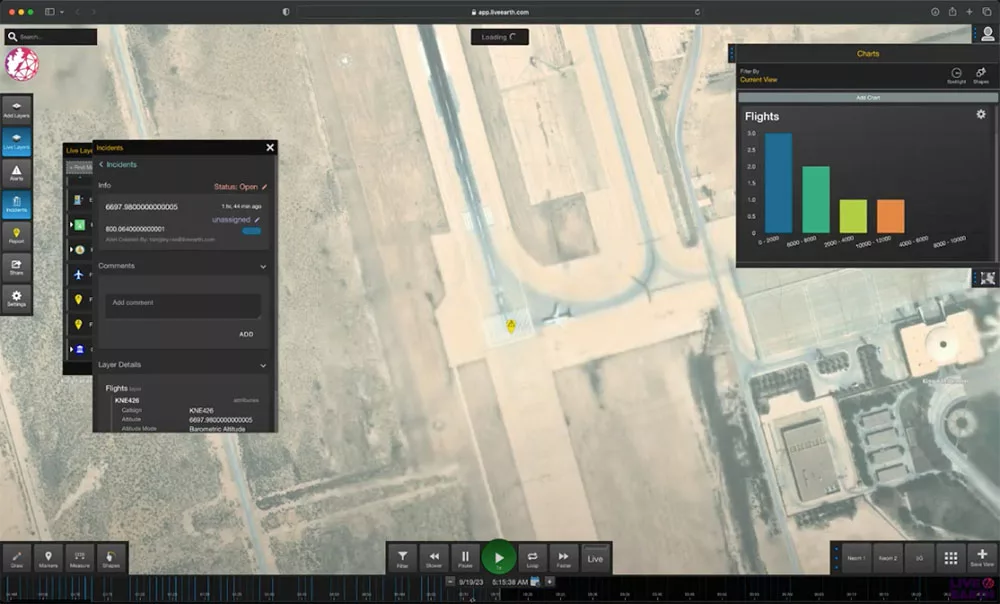
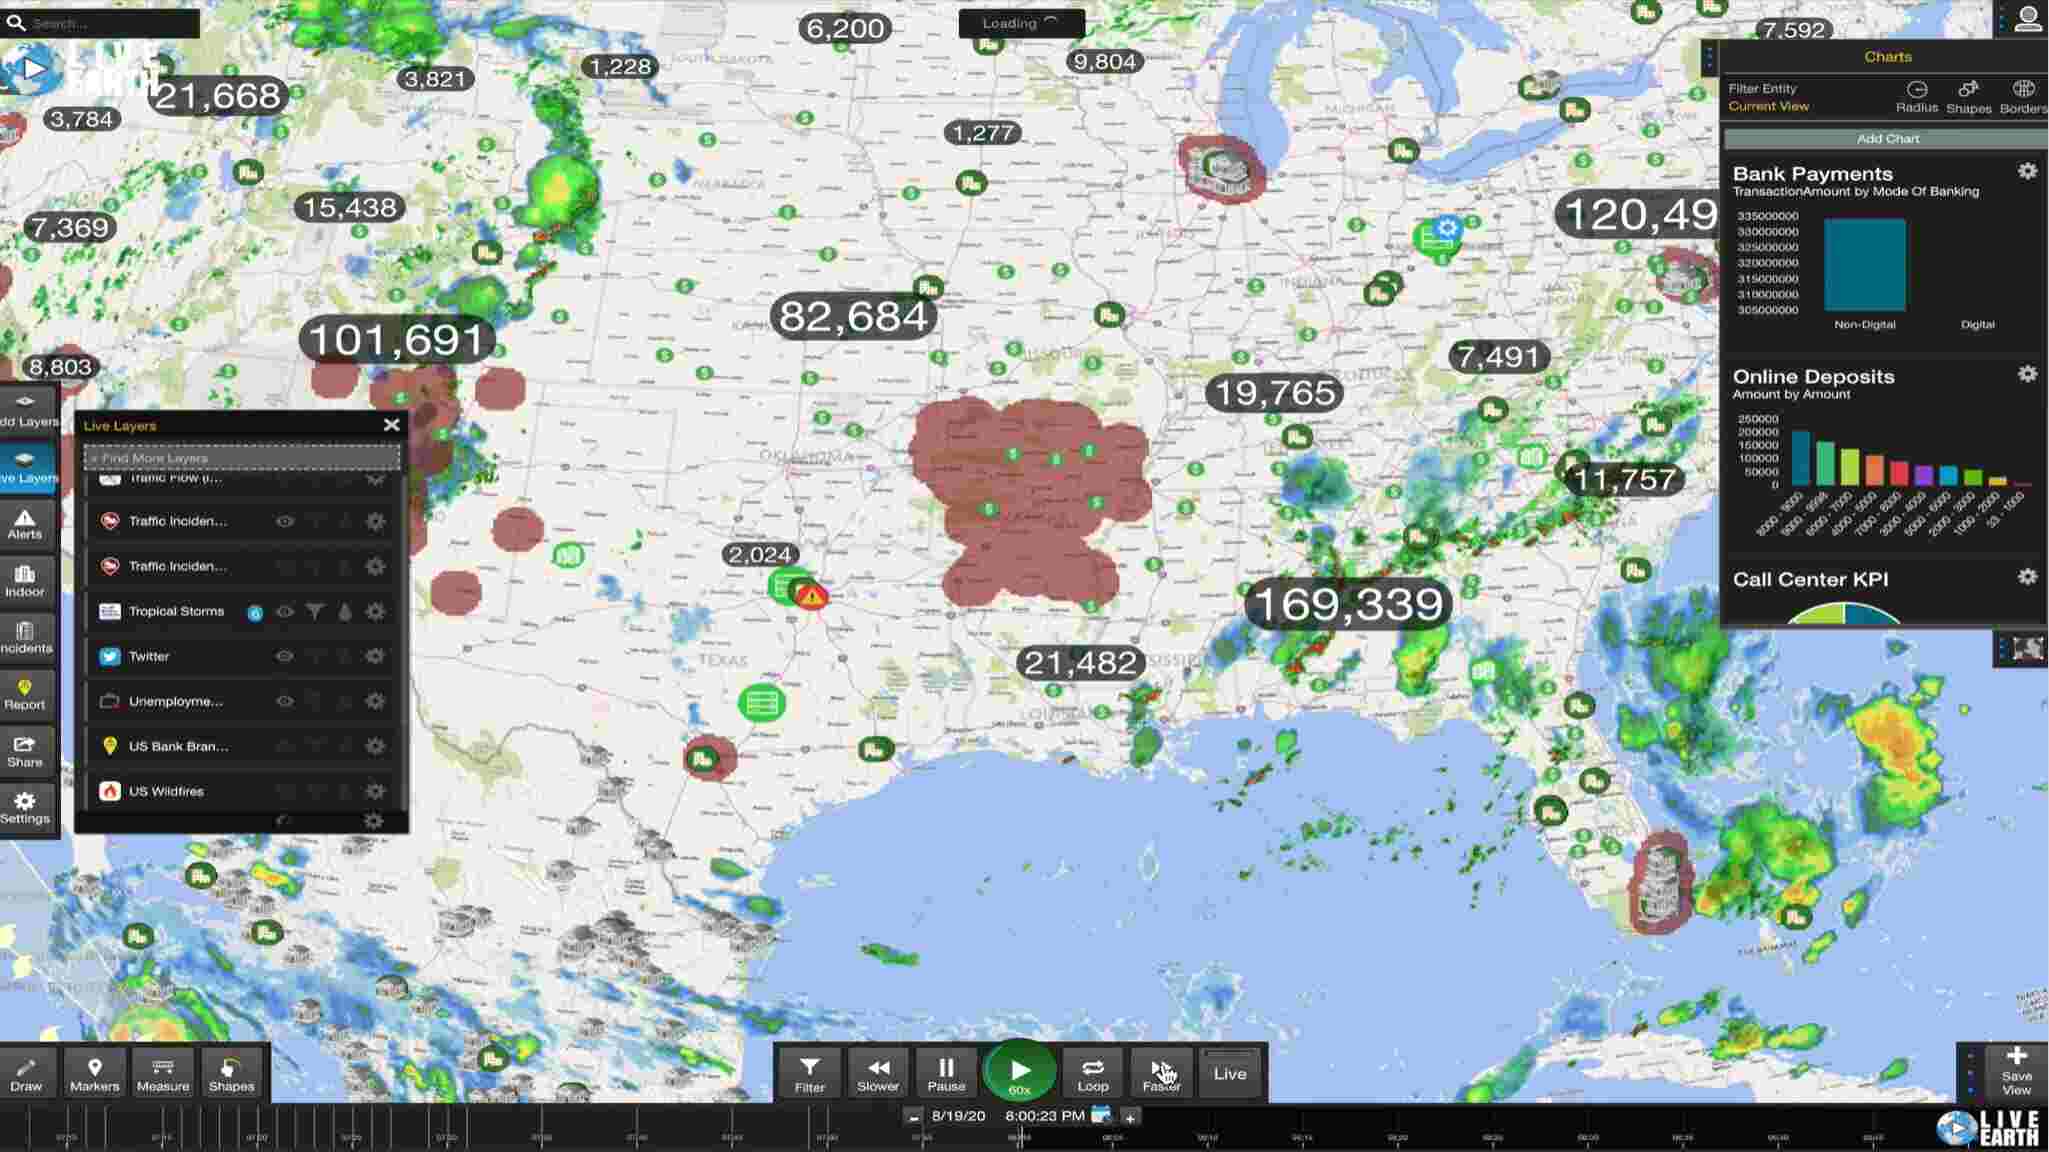
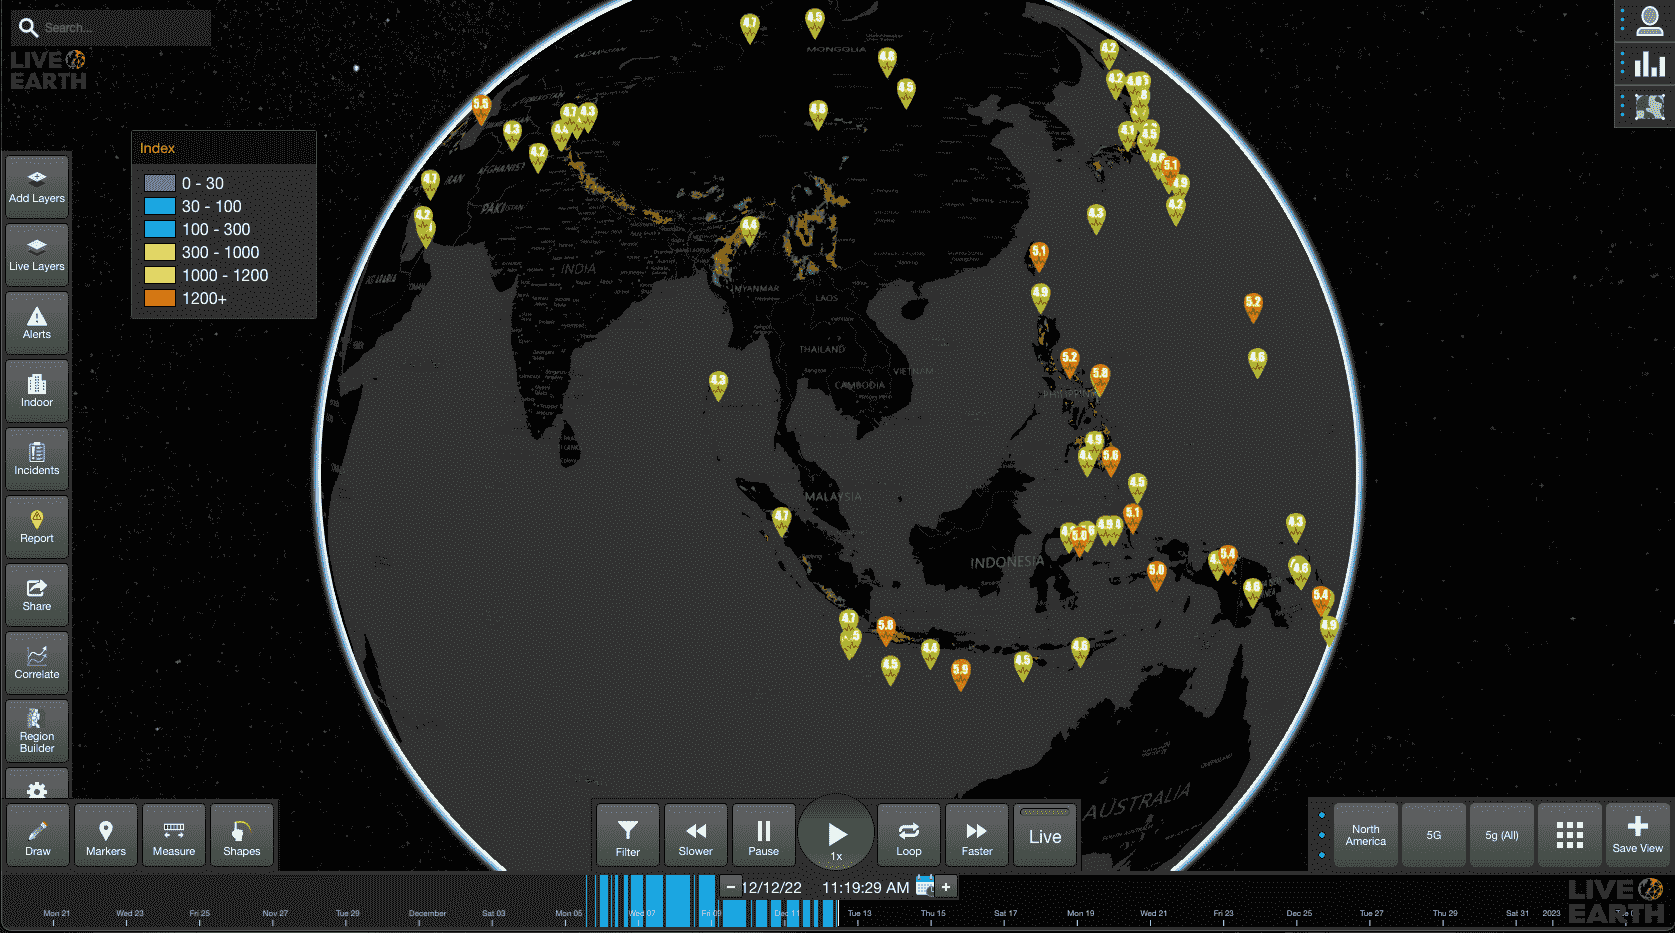
Data Visualization and Analytics: What’s The Difference?
“Data is the new oil,” said a data scientist named Clive Humby back in 2006, alluding to the immense untapped value of data. Nearly two decades later, it’s already clear
As data and data analysis become more important for businesses, they are increasingly turning to AI databases over traditional database solutions. This database approach incorporates artificial intelligence (AI) to build
Every business leader wants to grow their business — the big question is, how do you approach that goal? It all starts with an in-depth analysis using data visualization analytics.
Data visualization is a way of graphically representing the information contained within data sets large and small. Done right, data visualization can help organizations get the most out of their
Major enterprises devote considerable time and resources to security efforts and for good reason. Between the growth of cyberattacks in recent years and other threats to companies, thorough safety and
It’s incredibly difficult to gain any valuable insights from looking at large amounts of raw data alone. Once translated into a visual context, however, that raw data becomes much easier
July 21, 2021 Patent: US-11055260-B2 In addition to the new patent Live Earth was awarded in June, we are proud to announce another new patent awarded from the efforts we’re
There are a myriad of different supply chain challenges that pharmaceutical companies face, and one important factor that contributes to these challenges is the lack of end-to-end visibility into inventory
Workforce management is the process where you maximize the performance and employee contribution within an organization. All these have a major goal of increasing product quality and profitability. Effective workforce
Data visualization is the graphical representation of data and information using visual elements such as maps, charts, infographics, tables, dashboards, and graphs. To better understand and see data patterns, trends,
Live Earth Texas Office
8350 N. Central Expressway, Suite 1900, Dallas, TX 75206
Cookie | Duration | Description |
---|---|---|
cookielawinfo-checkbox-analytics | 11 months | This cookie is set by GDPR Cookie Consent plugin. The cookie is used to store the user consent for the cookies in the category "Analytics". |
cookielawinfo-checkbox-functional | 11 months | The cookie is set by GDPR cookie consent to record the user consent for the cookies in the category "Functional". |
cookielawinfo-checkbox-necessary | 11 months | This cookie is set by GDPR Cookie Consent plugin. The cookies is used to store the user consent for the cookies in the category "Necessary". |
cookielawinfo-checkbox-others | 11 months | This cookie is set by GDPR Cookie Consent plugin. The cookie is used to store the user consent for the cookies in the category "Other. |
cookielawinfo-checkbox-performance | 11 months | This cookie is set by GDPR Cookie Consent plugin. The cookie is used to store the user consent for the cookies in the category "Performance". |
viewed_cookie_policy | 11 months | The cookie is set by the GDPR Cookie Consent plugin and is used to store whether or not user has consented to the use of cookies. It does not store any personal data. |