With the unprecedented ability to integrate massive data sets and advanced analytics into a common geospacial platform, Live Earth is providing Corporations, Cities, States, and Governments the ability to aggregate data sources to better understand, plan for, and respond to the outbreak of Coronavirus (COVID-19) in our communities.
Leveraging data sets from Johns Hopkins, Local First Responders, Area Hospitals, Public and Private data feeds, we are providing both real-time analysis of a number of data sources to uncover hidden trends and patterns. Using advanced data analytics and leveraging massive amounts of information, Live Earth provides insights to help flatten the curve of Coronavirus cases.
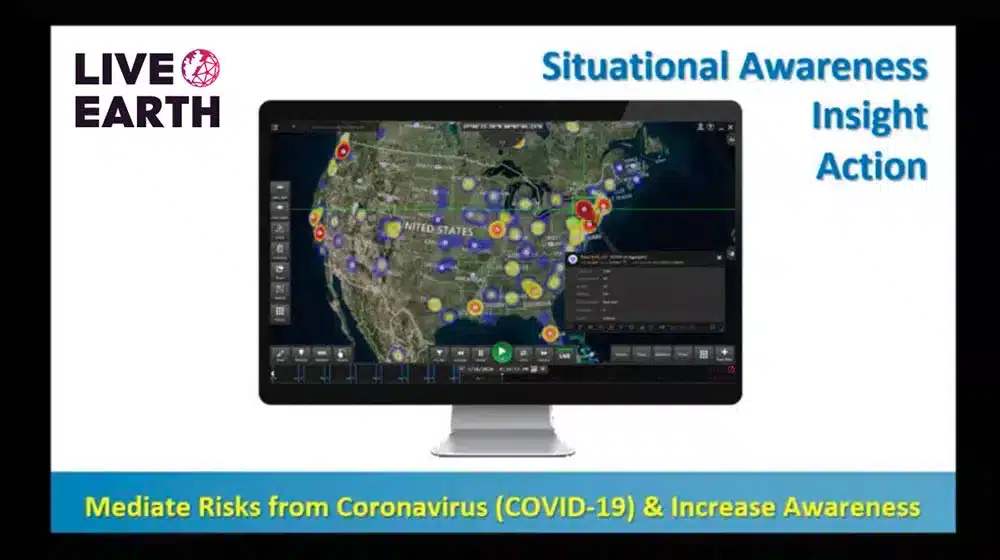
View Heat Map of the Spread of Coronavirus in the USA
Live Earth is a data visualization software that integrates millions of data sources, correlates them in real-time and presents them on an intuitive interactive map. This provides advanced situational awareness and business intelligence. Big data visualization helps organizations make faster decisions to protect their most important assets.